
06/14/2018
Unity rocks!
I recently built a calibration tool (for calibrating a multi-camera system here at work). Basically the app allows you to capture a set of calibration boards and then compute the intrinsics and extrinsics for the cameras. Here is a screen shot:
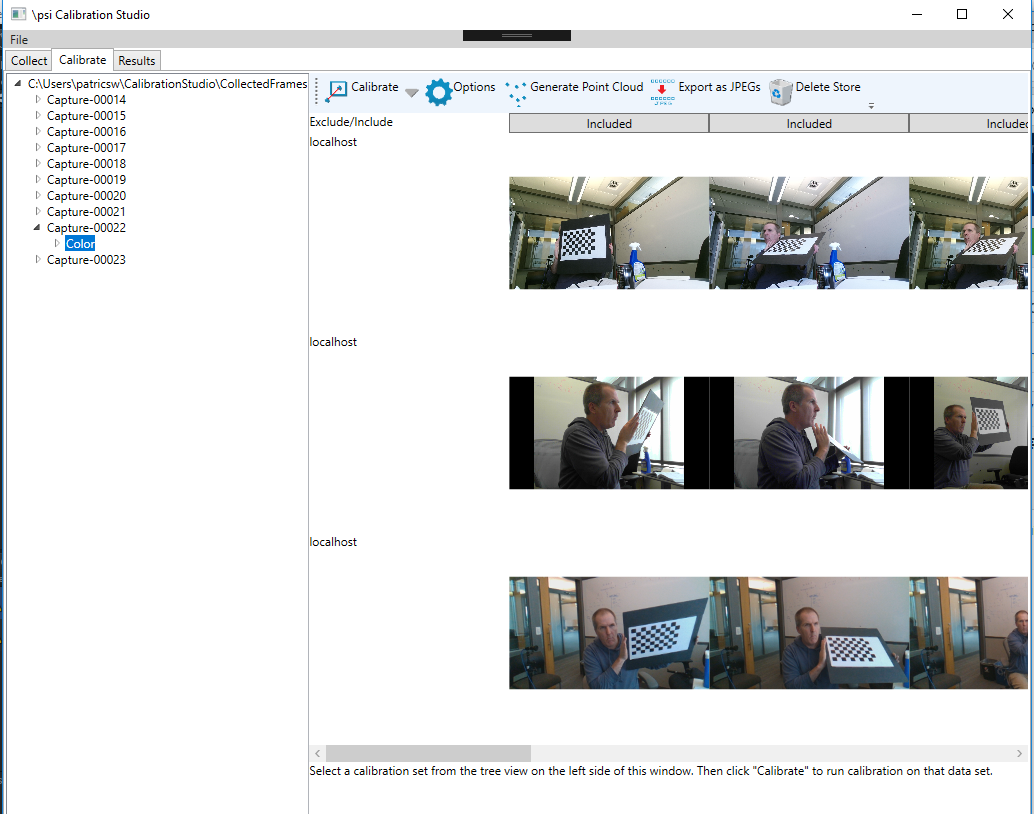
The problem I was having is that my intrinsics were coming out great (< 0.7 pixel error) but the extrinsics were coming out crap. I was trying to debug this but having a hard time visualizing what exactly was happening. Origiinally I decided I would just output the data using Collada and Visual Studio's builtin Collada viewer. This was okay, but a major pain (since if I wanted something as simple as a sphere in my scene I had to generate it). Instead, I flipped it over to Unity and just output a simple script that dynamically adds stuff to the scene. For instance, here is the start of one script:
using System.Collections;
using UnityEngine;
public class NewBehaviourScript2 : MonoBehaviour {
    // Use this for initialization
    void Start() {
        GameObject sphere0 = GameObject.CreatePrimitive(PrimitiveType.Sphere);
        sphere0.transform.localScale = new Vector3(10.0f,10.0f,10.0f);
        sphere0.GetComponent().material.color = new Color(1.000000f, 0.000000f, 0.000000f);
        sphere0.transform.position = new Vector3(-244.190948f, -165.309082f, 1257.367798f);
        ...
Then just attach this script (which is thousands of lines long as it creates various debug objects I want to visualize) to an empty game object. Start Unity's player and now I get stuff like:
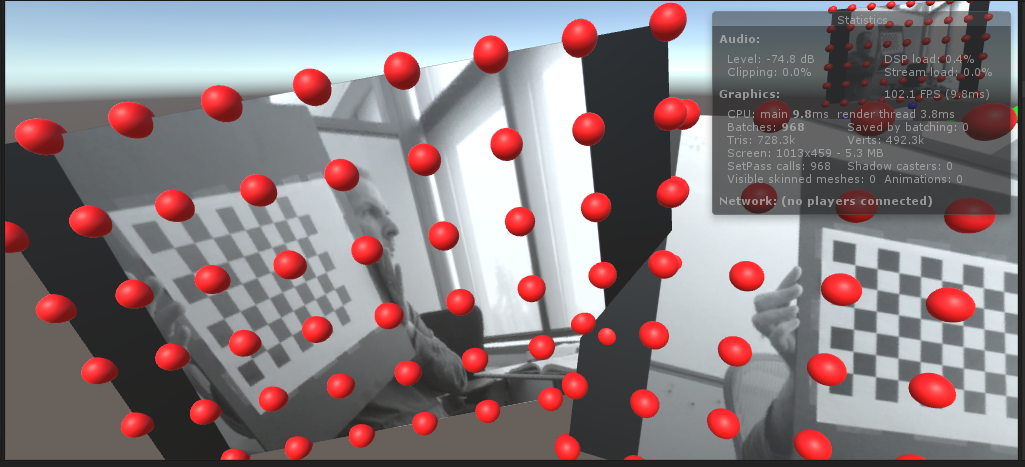
which makes it very easy to visualize what is happening.